Adom Gantt
Public Made by Adomby adom
Interactive Gantt chart viewer for project timelines, with a table view over the same data. Data-driven, dark by default with a print-friendly light mode, and fully editable in the browser: drag bars to move or resize, multi-select and batch-shift dates, manage dependency arrows inline, reorder rows, filter by phase, and undo. Toggle to the table for every task and milestone as a row with owner, deadline and status, filtered per owner and edited in place. Every edit is recorded in an append-only
| Name | Last updated |
|---|---|
| docs | 12h ago |
| examples | 11d ago |
| screenshots | 11d ago |
| .gitignore | 11d ago |
| favicon.svg | 11d ago |
| gantt.html | 12h ago |
| install.sh | 11d ago |
| package.json | 12h ago |
| page.json | 12h ago |
| README.md | 12h ago |
| s1.log | 3d ago |
| s2.log | 3d ago |
| server.js | 3d ago |
| SKILL.md | 12h ago |
| uninstall.sh | 11d ago |

adom-gantt
Interactive Gantt chart viewer for project timelines. Data-driven, dark by default with a print-friendly light mode, and fully editable in the browser.
Features
Two lenses over one plan. A Gantt / Table toggle in the header. The chart answers "when". The table answers "whose, and by when": every task and every milestone as a row with Owner, Start, Deadline, Status and Notes, sortable on any column, filtered to one person with the owner dropdown, and editable in place. An edit made in the table is already true on the chart when you toggle back, because there is only one set of items underneath. The choice of lens persists, and project.view.mode can pin it for a plan that is an assignment list more than a timeline.
Add rows. The New button creates a task or a milestone: name, lane, owner, dates, status, notes and provenance. Created rows live in the sidecar, so the data file is never rewritten, and they appear in every export.
Four statuses. Not started, in progress, blocked, complete. Plans written against the older "live" and "planned" still read correctly without being changed.
Edit any row. Hover a row in the chart's label column and an Edit button appears at its right edge: one click opens the full editor for every field. Single-clicking the name still edits it in place.
Resizable table columns. Drag the divider between any two headers, or double-click it to fit the widest value. Widths persist.
Collapse a lane. The chevron at the right of each phase header hides that lane's rows and shows how many. Collapsing hides rows, not time: the axis does not move and Fit still fits the whole plan. This is your view only, it is not part of the plan.
Rename in place. Click a name in the chart's label column to edit it right there; double-click for the full editor with every field. Drag a task across a lane boundary and it changes lane, one undo for the whole move.
Drag to reorder. Click and hold a row for a moment to lift it, then drop it where it belongs. Dropping into another lane moves it there, position and phase in one step and one undo. Drag a lane header on the chart to move the whole lane. Dates read 17-Aug-2026 throughout; stored data stays ISO.
Edit the plan from the table. Names, phase, owner, dates, status, notes and provenance are all editable in place, and a row can be deleted with one click and an undo toast. Moving a row to another phase re-homes it under that lane's group header on the chart, not just in the data. Deletions are recorded explicitly in the sidecar, so restoring a saved plan can never confuse "removed on purpose" with "row lost".
Provenance. Every item can say where it came from: "provenance": {"label": "POR", "url": "https://..."}, or just "Drew added this". The table shows it as a chip, linked when the url is http or https and as plain text otherwise, so a hostile url can never become a link.
Owner is a first-class field. Put "owner": "Adonis" on a task or a milestone: one name, never a team. It drives the table's owner filter, it round-trips through CSV and JSON export, and changing it is recorded in the changelog like any other edit.
Visual timeline. Color-coded phase bars, diamond milestones, dependency arrows, and a live "today" marker. Date range and month count auto-computed from data.
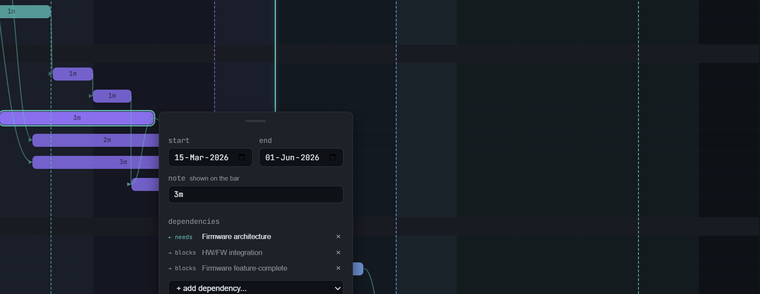
Click-to-edit. Click any bar to open an inline editor with date pickers and dependency management. Drag bar edges to resize start/end dates. Drag bar body to slide dates while preserving duration.
Multi-select. Ctrl+click to toggle individual items, Shift+click for range select (Windows Explorer style). Batch editor applies relative date shifts across all selected tasks without flattening dates.
Vertical reorder. Drag bars or labels up/down to reorder rows. Drop indicator shows insertion point. Multi-select reorder moves all selected items together.
Dependency arrows. Teal bezier curves with arrowheads show task relationships. Click any bar to see incoming ("needs") and outgoing ("blocks") dependencies. Add or remove dependencies inline.
Legend filtering. Click any phase, "Milestone", "Dependencies" or "Today" in the legend bar to toggle visibility. Dimmed items fade to 15% opacity; hiding "Today" removes the marker line.
New items remember the last one. After you create a task or milestone, the next New panel prefills the owner and both dates from it, so adding several items for the same person in the same week is just names. Name and notes always start empty. It lasts the page session only: a refresh clears it, and it is never saved to your preferences or the plan, so it is never handed to anyone else.
Undo. Ctrl+Z undoes date edits, dependency changes, drag operations, row reorders, and table edits to owner, status and notes (100-level stack).
Import. JSON (native format), CSV, MS Project XML, and Jira CSV. Drag-and-drop or file picker. A file with rows that carry no usable date is rejected whole, naming the rows, rather than having a date invented for it. A row that cannot be dated is left out of the chart with a warning instead of blanking the plan.
Export. JSON, CSV, SVG, and self-contained HTML (no server needed to view the snapshot). CSV carries the phase by name, so an export re-imported keeps its phases, and any cell opening with a formula character is apostrophe-guarded so a spreadsheet cannot execute it. Import strips the guard back off.
Auto-save. Edits persist to a sidecar JSON file next to the data file, debounced while you work and flushed immediately if you close or hide the tab, so the changelog never claims an edit the sidecar did not get. Delete the sidecar to reset. The format is additive: a sidecar written by an older version still loads. Rows are keyed by a stable index rather than by their own text, so renaming a milestone keeps it in the plan, and the saved row order is applied all-or-nothing so a stale key can never drop a row.
Fills the window. Cells stretch to the width of the pane, and stop at each grain's minimum so a long plan scrolls horizontally rather than squashing into unreadability. Resizing reflows without a reload.
Light mode. Dark by default. The Light toggle switches to a print-friendly theme with deepened bar colors, and printing always uses it whatever the screen is set to.
Brand phase colors. A phase with no explicit color cycles the three Adom hues: teal, purple, blue. There is no background band behind a phase: the bar colour and the group header carry the section on their own, so colour on the chart means exactly one thing, which phase a bar belongs to. The hues are theme-aware, so the same plan is on-brand on screen and legible on paper.
Move the whole plan. The project start sits in the header. Change it and every task, milestone and phase shifts by the same number of days, so durations and the gaps between them survive. Revert puts the plan back to the data file's own start. It is one undo step and one changelog entry, not 26.
Text size. A-minus and A-plus at the right end of the header step the whole app between 85% and 150% in seven steps, chart and table together. The percentage between them is the reset. Rows, bars and the axis grow with the type, so nothing is clipped, and the choice persists.
Fit to the pane. One click on Fit picks the finest cell size that shows the whole plan without scrolling sideways, then stretches the cells to fill the width exactly. Click it again after resizing the window to re-fit.
Cell size. Days, Weeks, Months, Quarters or Years. Each grain carries its own minimum cell width, sized to the widest label it draws, so a fine grain scrolls rather than squashing and a coarse one stretches to fill. Days adds weekend shading and a full calendar picker.
Editable milestones. Drag a milestone sideways to move its date, or click it to edit its name, date and description. Line style is the default: the tag on the dashed rule is the handle and the milestone's own row is hidden, since the rule already spans the chart. Long titles wrap, and a tag that would still collide with its neighbour drops to a second row. Diamond style keeps the row.
Bar notes. Put a short label on the bar body, the way durations are annotated on a printed plan. Double-click a bar to type one, or use the note field in the editor.
Resizable name column. Drag the divider between the names and the timeline, or double-click it to fit the longest name. The width persists.
Room to scroll. You can scroll past the last row, so the bottom of the plan can sit centred in the pane instead of pinned to the bottom edge.
Clean group labels. A trailing date range in a group label is dropped at render, since the axis already shows the dates and the text goes stale as soon as the plan moves.
Authored default view. project.view in the data file pins how the chart opens: lens (mode), grain, milestone style, today marker, theme and name-column width. The HTML export bakes it in and ignores the viewer's saved preferences, so a shared snapshot always matches the image that invited the click. In the live app your own choices still win.
Changelog. Every edit is appended to <datafile>-changelog.jsonl with the item, the before and after dates, the day shift, and which gesture made it. An AI picking the project up later reads it and builds on your changes instead of overwriting them. The rev counter in the bottom-left corner is the handle: an agent notes it, then asks for only what changed since.
In action
Click a bar and the inline editor opens over the chart: date pickers for start and end, plus the incoming ("needs") and outgoing ("blocks") dependencies, each removable, with a picker to add more.
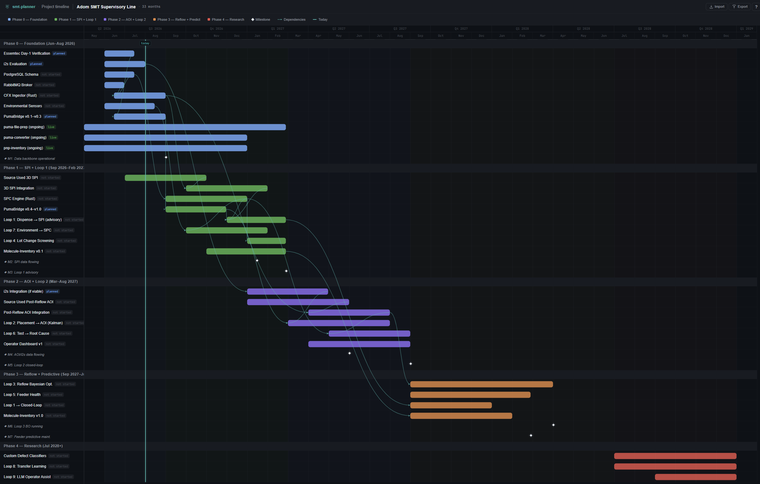
The layout scales to real plans. This is the bundled SMT production line example: 5 phases, 43 items, 8 milestones, striped bars for ongoing work:
Quick start
node server.js --data examples/sample-product-launch.json --port 8901
Open http://localhost:8901 in a browser, or point a Hydrogen webview tab at the proxy URL.
Data file format
Create a JSON file with three sections:
{
  "project": {
    "title": "My Project",
    "subtitle": "Short description"
  },
  "phases": [
    { "name": "Phase 1 — Build", "start": "2026-01", "end": "2026-06" }
  ],
  "items": [
    { "type": "group", "label": "Phase 1 — Build", "phase": 0 },
    { "type": "task", "id": "t1", "name": "Task name", "start": "2026-01-15", "end": "2026-03-01", "phase": 0, "owner": "Adonis", "status": "planned", "description": "Details.", "deps": ["other-id"] },
    { "type": "milestone", "name": "M1: Goal reached", "date": "2026-06-01", "phase": 0, "description": "What this means." }
  ]
}
Omit color on a phase and it follows the Adom brand ramp, which adapts between dark and print. See SKILL.md for the full field reference and the ramp values.
Keyboard shortcuts
| Key | Action |
|---|---|
| Ctrl+Z | Undo |
| Up / Down | Move the selected row in the table, following the visible order under sorts and filters. They never scroll the pane by themselves; it moves only enough to keep the selected row in view |
| Enter | Edit the selected row's name. Inside a cell, commit and step down one row |
| Shift+N | Open the New panel. Fires only when nothing else is going on, so a capital N typed into a field stays a capital N |
| Alt+Up / Alt+Down | Move a row one slot: the focused row in the table, the selected task in the chart. Crossing a lane boundary moves the row into that lane. Under a column sort the row stays inside the run of rows the sort considers tied with it |
| Tab / Shift+Tab | In the table, commit the open cell editor and open the next one, ready to type. Wraps across rows and around the ends, and follows the visible order under a sort |
| Esc | Cancel the open field, then clear the row focus, then clear the selection |
| Ctrl+click | Toggle item in selection |
| Shift+click | Range select |
The focused row is the row whose cell editor you touched last, marked with an accent bar down its left edge. It is not a separate thing to click: the edit you were already making is what tells Alt+Up and Alt+Down which row you mean.
Interactions
Dragging a bar snaps it to the visible time grid: day boundaries at the day cell size, week starts at weeks, month, quarter and year firsts at the coarser ones. The preview jumps line to line as you cross each midpoint, and what you see is what is committed. Resizing an edge moves that edge only; dragging the body moves the start and keeps the duration. Milestones snap the same way. Dates typed into the table, the item editor or the batch editor are taken exactly as typed.
| Gesture | Action |
|---|---|
| Gantt / Table | Switch lens. Pinned to the left of the header so it never moves |
| Fit | Fit the whole plan into the pane, no horizontal scrolling |
| A- / A+ | Step the text size for both views. Click the percentage to reset |
| Hover "today" | The current date |
| Click a table cell | Edit owner, start, deadline, status or notes in place |
| Click a table header | Sort by that column (deadline ascending by default) |
| Click bar or label | Select + open editor |
| Drag bar edge | Resize start or end date |
| Drag bar body | Move bar (preserves duration) |
| Drag vertically | Reorder rows |
Server endpoints
| Endpoint | Method | Description |
|---|---|---|
/data |
GET | Current project data |
/state |
GET | Saved edits (sidecar) |
/save |
POST | Persist edits |
/changelog |
GET | Edit history. ?since=<rev> for the tail, ?format=md for the readable version |
/log |
POST | Append events to the changelog (used by the app, and by an AI recording its own edits) |
/changelog/reset |
POST | Delete the changelog |
/import/json |
POST | Import native JSON |
/import/csv |
POST | Import CSV |
/import/msproject-xml |
POST | Import MS Project XML |
/import/jira-csv |
POST | Import Jira CSV |
/compact |
POST | Bake saved edits into the data file and empty the sidecar |
/export/json |
GET | Export merged JSON |
/export/csv |
GET | Export CSV |
/export/svg |
GET | Export SVG |
/export/html |
GET | Export self-contained HTML |
Examples
Two example datasets are included:
examples/sample-product-launch.json: 4-phase hardware product launch (26 items, 4 milestones, dependency graph)examples/smt-line.json: 5-phase SMT production line build (43 items, 8 milestones)
Collaboration
Each team member runs their own server instance with the same data file. Use Export (JSON) to share the current state and Import (JSON) to load a colleague's version. The data file and sidecar state file can also be committed to a shared git repo for async collaboration.
License
Internal tool. Adom Inc.