Adom Gantt
Public Made by Adomby adom
Interactive Gantt chart viewer for project timelines, with a table view and an analytics page over the same data. Data-driven, dark by default with a print-friendly light mode, and fully editable in the browser: drag bars to move or resize, multi-select and batch-shift dates, manage dependency arrows inline, reorder rows, filter by phase, and undo. One click auto-schedules the whole plan so every dependency lines up finish-to-start on working days, skipping weekends and US federal holidays, push

Install?
Interactive Gantt chart viewer for project timelines, with a table view and an analytics page over the same data. Data-driven, dark by default with a print-friendly light mode, and fully editable in the browser: drag bars to move or resize, multi-select and batch-shift dates, manage dependency arrows inline, reorder rows, filter by phase, and undo. One click auto-schedules the whole plan so every dependency lines up finish-to-start on working days, skipping weekends and US federal holidays, pushing work LATER only so a lead-time gap you set on purpose is never closed, and one more lights up the critical path, meaning the longest run of work inside every section at once. Cancelled work is left out of both: it never moves, it constrains nothing and it can never glow. Dependency arrows are coloured by the phase of the task they come out of, so where a chain starts reads at a glance. Toggle to the table for every task and milestone as a row with owner, deadline and status, filtered per owner and edited in place, or to analytics for total, remaining and average hours, one row per person carrying both their hours and their status counts, per-section totals, milestones, dependency stats and what is overdue. Copy and paste rows: Ctrl+C the selected tasks and milestones, Ctrl+V to drop clones directly below a selected row or at the end of the lane you are looking at, with dependencies AMONG the copied rows remapped onto the copies so a duplicated chain is still a chain, links pointing outside it left naming the originals, and the whole paste one undo and one changelog line. Five statuses in lifecycle order, not started, in progress, complete, blocked, cancelled, with cancelled keeping the row and its history on the plan while taking its hours out of every total. Every edit is recorded in an append-only changelog so an AI can read what a human changed and build on it. Imports JSON, CSV, MS Project XML and Jira CSV; exports JSON, CSV, SVG and a self-contained HTML snapshot.
adom-wiki pkg install adom/adom-ganttLatest: v0.59.0, published
Contents
- Features
- In action
- Quick start
- Data file format
- Sections are phases
- Item ids that do not move
- Sharing a plan with your team
- Letting an AI agent write, without breaking the history
- Known limitation: two people editing at once
- Keyboard shortcuts
- Interactions
- Server endpoints
- Examples
- Tests
- Collaboration
- License
README
markdownadom-gantt
Interactive Gantt chart viewer for project timelines. Data-driven, dark by default with a print-friendly light mode, and fully editable in the browser.
Features
Auto-schedule the whole plan, by pushing later only. One press of Auto-schedule moves every task out until it starts no earlier than the work it waits on has finished, and so that nothing starts or ends on a Saturday, a Sunday or a US federal holiday. The handoff is a MINIMUM rather than an answer. A task that starts BEFORE its latest dependency's end is pushed out to it, so the two bars meet on the chart with no column of white between them; a task that already starts on or after it is LEFT EXACTLY WHERE IT IS. That is what keeps a gap you meant: an order placed on the Monday and the parts that arrive on the Thursday keep their three days, because a lead time is real elapsed time and not a tidying-up job. Nothing is ever pulled EARLIER, so a plan cannot drift backwards over a press and a second press moves nothing at all. Pushes cascade, so a task moved out moves its own successors, measured against where they landed. A task with no dependencies is an anchor and keeps its start, since that is the one thing the plan cannot derive. Durations are preserved in WORKING days, so a five-day task laid across a weekend, or across Labor Day, still takes five working days: a predecessor that ends on the Friday hands off on the Friday, and the weekend sits inside the successor's span rather than between the two of them. Milestones take the same rule with no duration. Cancelled work is out of the pass entirely: it never moves, and it constrains nobody, so a task whose only dependency is cancelled behaves like an anchor and the toast counts the excluded rows as their own number. The dependency graph crosses sections freely and so does the schedule. A cycle is left exactly as it is, named in the toast, because there is no honest answer for a row that waits on itself. It is one Ctrl+Z for the whole pass and one line in the changelog, and pressing it on an already aligned plan reports "0 tasks moved" and writes nothing.
Critical path, one per section. Critical lights up the LONGEST run of work inside every section at once: the bars, the dependency arrows along it and any milestone on it glow white and breathe, in a saturated indigo on paper. The dependency graph is read as a DAG, a task weighs its duration in WORKING days (weekends and US federal holidays excluded) and a milestone weighs nothing, and the critical path is the maximum-weight path through it. So it is the hardest run of work and not merely whatever chain happens to end last. A gap between two tasks adds no weight, because the length is the sum of the work along the path and not the calendar it is spread over, so the gaps Auto-schedule now preserves cannot promote or demote a chain. Cancelled work is not in the graph: it can never glow, it carries no weight, and a chain that ran through it is broken at that row, so the section falls back to whatever the longest run through the work that is still live turns out to be. Un-cancelling puts the row, its links and every path through it straight back, because nothing was deleted. Nothing is rescheduled: it reads the dates the plan has right now, independently of Auto-schedule.
A plain on/off toggle. Each lane is answered on its OWN subgraph, so a dependency that crosses sections is not an edge and never lights up, and a section with no dependencies among its own rows lights its longest single row. Ties are broken deterministically: more working days, then a greater calendar span, then more rows, then whichever starts earlier in the plan. Everything else stays exactly as it was, selection and dependency mode included, the glow recomputes as you edit, and the state is remembered across reloads.
Analytics. A third lens, next to Gantt and Table. Total effort for the plan in hours (working days times eight, a forty-hour week), the working hours LEFT between today and the project end, the AVERAGE hours per assigned person, then one row per person carrying their hours, share and item counts alongside their five status counts, the unassigned bucket included. Status counts overall, per-section totals with the range each section actually covers, milestones with days from today, dependency stats with a cycle warning, and everything overdue. Read-only, whole-plan, and re-derived from the same rows every time you switch to it.
Setup. A fourth lens, since 0.58.0, for the plan's structure rather than its work. It is where the sections are managed: add one, rename it and set its aside, recolour it, move it up or down, or remove it, each row showing how many rows the section holds and the dates they span. Since 0.59.0 it is also where sections are tagged, one by one or from their name prefixes in one click, and where a tag is renamed or removed everywhere. It replaces the Sections button that used to sit in the header and open a modal. Every change is still one Ctrl+Z and one changelog line.
Four lenses over one plan. A Gantt / Table / Analytics / Setup toggle in the header. The chart answers "when". The table answers "whose, and by when": every task and every milestone as a row with Owner, Start, Deadline, Status and Notes, sortable on any column, filtered to one person with the owner dropdown, and editable in place. An edit made in the table is already true on the chart when you toggle back, because there is only one set of items underneath. The choice of lens persists, and project.view.mode can pin it for a plan that is an assignment list more than a timeline.
Add rows. The New button creates a task or a milestone: name, lane, owner, dates, status, notes and provenance. Created rows live in the sidecar, so the data file is never rewritten, and they appear in every export.
Five statuses, in lifecycle order. Not started, in progress, complete, then the two ways off that road: blocked and cancelled. Every surface takes that order from one list, so the panels, the create panel, the status filter, the inline pill list, the analytics status card, the per-person card's five columns and the table's status-column sort all read the same way, and sorting by status ranks a finished row ahead of a stuck one. Plans written against the older "live" and "planned" still read correctly without being changed, and so do the American "canceled" and a tracker's "won't do".
Cancelled is work that will not happen, which is a different thing from work that is finished. The row stays on the plan, because deleting it would lose why it was ever there and what used to depend on it, but its HOURS leave every total: the project total, the owner's load, the section's effort and every percentage computed from them. Its own numbers are untouched, so the bar, the tooltip, the export and Ctrl+Z all still say what they said. It still counts as an item and it still has a column on the status cards, because it is a decision somebody made and worth seeing. It is never overdue. On the chart the bar is dimmed and the row is muted, well short of the fade a filtered-out row gets, and the pill carries a line through it.
Edit any row. Hover a row in the chart's label column and an Edit button appears at its right edge: one click opens the full editor for every field. Single-clicking the name still edits it in place.
Resizable table columns. Drag the divider between any two headers, or double-click it to fit the widest value. Widths persist.
Collapse a lane. The chevron at the right of each phase header hides that lane's rows and shows how many. Collapsing hides rows, not time: the axis does not move and Fit still fits the whole plan. This is your view only, it is not part of the plan. Collapse all at the start of the legend folds every lane to its header in one press, and reads Expand all once they are all folded; the table follows the chart.
Rename in place. Click a name in the chart's label column to edit it right there; double-click for the full editor with every field. Drag a task across a lane boundary and it changes lane, one undo for the whole move.
Drag to reorder. Click and hold a row for a moment to lift it, then drop it where it belongs. Dropping into another lane moves it there, position and phase in one step and one undo. Drag a lane header on the chart to move the whole lane. Dates read 17-Aug-2026 throughout; stored data stays ISO.
Edit the plan from the table. Names, phase, owner, dates, status, notes and provenance are all editable in place, and a row can be deleted with one click and an undo toast. Moving a row to another phase re-homes it under that lane's group header on the chart, not just in the data. Deletions are recorded explicitly in the sidecar, so restoring a saved plan can never confuse "removed on purpose" with "row lost".
Provenance. Every item can say where it came from: "provenance": {"label": "POR", "url": "https://..."}, or just "Drew added this". The table shows it as a chip, linked when the url is http or https and as plain text otherwise, so a hostile url can never become a link.
Owner is a first-class field. Put "owner": "Adonis" on a task or a milestone: one name, never a team. It drives the table's owner filter, it round-trips through CSV and JSON export, and changing it is recorded in the changelog like any other edit.
Visual timeline. Color-coded phase bars, diamond milestones, dependency arrows, and a live "today" marker. Date range and month count auto-computed from data.
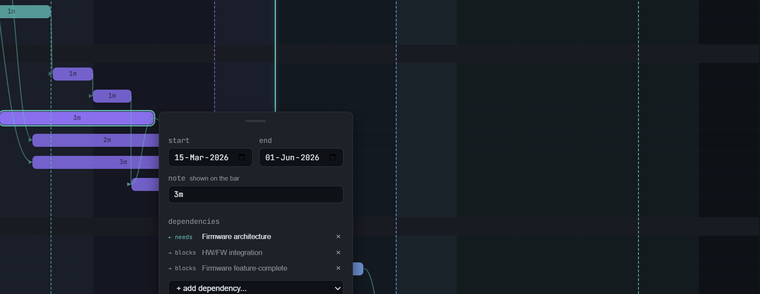
Click-to-edit. Click any bar to open an inline editor with date pickers and dependency management. Drag bar edges to resize start/end dates. Drag bar body to slide dates while preserving duration.
Status is editable from the chart. Click a task's status pill in the label column to change it from a small on-brand dropdown (not started / in progress / complete / blocked / cancelled). It is the same edit as the table's status cell: one undo, logged to the changelog, reflected in both lenses.
Esc gets you out of a field. Every text box in the app hands the keyboard back when you press Escape: the table's filter box, the panel fields, the section editors, the type-in on the owner list, the date fields. The text you typed stays exactly where it is, so a filter you built is never wiped by a stray key, and the shortcuts are live again immediately rather than after a trip to the mouse. One Escape is one action: it never blurs a field AND closes something behind it in the same press.
Owner is editable from the chart too. Right of the status pill, every task row carries an owner pill, showing who has it or a quiet "unassigned" when nobody does. Click it for a list of everyone already on the plan, plus a field for a name that is not on it yet; a new name is offered to every other row the moment it commits. Same path as the table's Owner cell, so it is one undo, one changelog event, and both lenses agree. The list scrolls when a plan has more people than it can show, by the wheel, the trackpad or the scrollbar; Escape closes it, so does a click anywhere outside it, and so does scrolling the plan out from under it.
Rename a row in place. Click the name text in the label column to edit it. Enter commits the new name, closes the field and leaves the row selected, so the rename hands straight over to the keyboard. Escape cancels.
Dependency arrows are coloured by where they come FROM. Each arrow takes the phase colour of the task at its tail, so a chain's origin is readable at a glance instead of every arrow being the same teal. A lane colour chosen to work as a wide bar can be invisible as a thin line, so the stroke is derived rather than copied: it is lifted or deepened away from the page, holding its hue, until it clears a 3:1 contrast ratio, which means a lane painted navy gets a lighter blue arrow that still reads as that lane. Picking an arrow in dependency mode, arming one for deletion and lighting the critical path all still override the colour while they are active. An arrow into or out of cancelled work is still drawn, dimmed by the same fraction the cancelled bar takes, so a link the schedule no longer walks recedes exactly as far as the work it points at.
The full item editor is the New panel. Editing a task or a milestone opens the same layout, in the same order, with the same labels, as creating one: type and lane, name, owner and status, the dates, notes and provenance. Type is shown but not editable on an existing row, because a task has two dates and a bar and a milestone has one date and a diamond, and dropping one of a task's dates is not a conversion. The buttons are Apply, Cancel and Delete, with Delete kept away from the other two.
The task editor remembers where you put it. The panel that opens on a bar is a compact 256px square, draggable by the strip at its top. It is meant to be glanced at rather than filled in: the row's name across the top, the two dates, the note, the dependency list (the one part that flexes, and the one part that scrolls) and the buttons, at desktop density, so it sits over as little of the chart it is editing as it can. The full Edit item panel, with the name, owner, status and provenance fields, is the one you fill in and it is unchanged. Drag it once and every panel after it opens in that same spot on screen, whatever row it belongs to and however far the chart has been scrolled, until the page is reloaded. Nothing is saved to the plan; it is a property of the sitting, and a refresh restores the automatic placement beside the bar.
Multi-select. Ctrl+click to toggle individual rows, Shift+click for range select (Windows Explorer style), in either lens. Tasks and milestones both, since both have a permanent id to be named by; lane headers do not join. The batch editor applies relative date shifts across the selected tasks without flattening dates, and says how many milestones it is leaving alone: a milestone has one date and no duration, so shifting its end has no meaning. Its Delete removes the whole selection, milestones included, in one press and one Ctrl+Z: the same path the chart's armed Delete key uses, so it is one undo entry, one changelog batch, dependencies on the departed rows dropped and their ids retired either way.
Copy and paste rows, and the chain comes with them. Select one row or several, Ctrl+C, then Ctrl+V. With a row selected the copies land DIRECTLY BELOW it, in its lane, recoloured to match; with nothing selected they go to the end of the lane you are looking at (on the chart, the lane whose header is pinned under the axis; in the table, the lane of the topmost row fully clear of the sticky header). The part that makes it worth having is the dependencies: links AMONG the copied rows are remapped onto the copies, so duplicating a five-step build across another workcell gives you a five-step build and not five rows all hanging off the originals. Links pointing OUTSIDE the copied set are kept exactly as they are, still naming the original, because that is a real fact about the work. Nothing downstream of an original is touched: a task that waited on the row you copied still waits on that row and not on both. Names are KEPT, so you can rename after rather than undoing " (copy)" five times; the exception is a name that would collide inside the destination lane, which gets " 2", then " 3", counting past whatever is already there. Every copy gets a permanent id of its own, minted by the server; if that mint cannot be made the paste is refused whole and says so, rather than leaving half a chain. Milestones copy too. The pasted rows become the selection and are scrolled into view, ready for Alt+Arrow or a drag, and the whole paste is one Ctrl+Z and one line in the changelog.
Vertical reorder. Drag bars or labels up/down to reorder rows. Drop indicator shows insertion point. Multi-select reorder moves all selected items together.
Dependency arrows. Teal routes with rounded elbows and arrowheads show task relationships: out of the source bar's end sideways, down, and into the next bar's start sideways again, steering round any bar in the way rather than through it. Click any bar to see incoming ("needs") and outgoing ("blocks") dependencies. Add or remove dependencies inline.
Legend filtering. Click any phase, "Milestone", "Dependencies" or "Today" in the legend bar to toggle visibility. Dimmed items fade to 15% opacity; hiding "Today" removes the marker line. The legend wraps onto as many lines as the plan needs, so a plan with twenty sections shows all twenty chips. When the sections carry tags (0.59.0), the legend leads with a chip per tag and the twenty section chips fold behind one "20 sections" chip; pick a tag and only the sections carrying it are shown, in the chart and the table, with their own chips back in the legend. Pick several to see any of them; Clear tags shows everything. It is your view only, and it survives a refresh.
How long, and how long left. The header says Project Duration and Time Remaining, worked out from the plan's own first and last dates and today, never from the cell size, leaving cancelled work out, and updated on every edit. They stay whole at every window width: the header sheds button words, then wraps, before it lets them be cut. A printed chart names the plan in a title line of its own. Hover either for the exact dates and the calendar and working-day counts. The plan itself is named once, in the brand block at the far left; its title and description are on that block's tooltip.
New items remember the last one. After you create a task or milestone, the next New panel prefills every field from it: type, lane, owner, status, both dates, notes and the provenance label. Only the name starts empty, so adding several items for the same person in the same lane in the same week is just names. Leave provenance at its default and it stays a default, following whoever is signed in rather than freezing a name into the session. It lasts the page session only: a refresh clears it, and it is never saved to your preferences or the plan, so it is never handed to anyone else. Cancel, Escape and a create rejected for a missing name all leave the memory exactly as it was.
Undo. Ctrl+Z undoes date edits, dependency changes, drag operations, row reorders, and table edits to owner, status and notes (100-level stack).
Import. JSON (native format), CSV, MS Project XML, and Jira CSV. Drag-and-drop or file picker. A file with rows that carry no usable date is rejected whole, naming the rows, rather than having a date invented for it. A row that cannot be dated is left out of the chart with a warning instead of blanking the plan.
Export. JSON, CSV, SVG, and self-contained HTML (no server needed to view the snapshot). The Export button serialises what is on your screen right now, not what is on disk, so it reflects unsaved edits and keeps working even when a save conflict has stopped autosave. CSV carries the phase by name, so an export re-imported keeps its phases, and a row's tags in a tags column joined with ; like its dependencies, and any cell opening with a formula character is apostrophe-guarded so a spreadsheet cannot execute it. Import strips the guard back off.
Auto-save. Edits persist to a sidecar JSON file next to the data file, debounced while you work and flushed immediately if you close or hide the tab, so the changelog never claims an edit the sidecar did not get. Delete the sidecar to reset. Every row in it is keyed by its permanent uid, so renaming a row, reordering the plan, or inserting a row into the middle of the data file all leave every saved edit pointing exactly where it was. Sidecars written by older versions keyed rows by position; they are translated on the way in and keep working. The saved row order is applied all-or-nothing, so a key that no longer resolves can never drop a row.
Fills the window. Cells stretch to the width of the pane, and stop at each grain's minimum so a long plan scrolls horizontally rather than squashing into unreadability. Resizing reflows without a reload.
Light mode. Dark by default. The Light toggle switches to a print-friendly theme with deepened bar colors, and printing always uses it whatever the screen is set to.
Brand phase colors. A phase with no explicit color cycles the three Adom hues: teal, purple, blue. There is no background band behind a phase: the bar colour and the group header carry the section on their own, so colour on the chart means exactly one thing, which phase a bar belongs to. The hues are theme-aware, so the same plan is on-brand on screen and legible on paper.
Move the whole plan. The project start sits in the header, as an exact date at every cell size. Change it and every task, milestone and phase shifts by the same number of days, so durations and the gaps between them survive. Revert puts the plan back to the data file's own start. It is one undo step and one changelog entry, not 26.
Text size. A-minus and A-plus at the right end of the header step the whole app between 85% and 150% in seven steps, chart and table together. The percentage between them is the reset. Rows, bars and the axis grow with the type, so nothing is clipped, and the choice persists across a refresh, in the live app and in an exported HTML snapshot alike.
Fit to the pane. One click on Fit picks the finest cell size that shows the whole plan without scrolling sideways, then stretches the cells to fill the width exactly. Click it again after resizing the window to re-fit.
Cell size. Days, Weeks, Months, Quarters or Years. Each grain carries its own minimum cell width, sized to the widest label it draws, so a fine grain scrolls rather than squashing and a coarse one stretches to fill. Days adds weekend shading, a differently coloured band on every US federal holiday with its name in a tooltip, and a full calendar picker.
Editable milestones. Drag a milestone sideways to move its date, or click it to edit its name, date and description. Line style is the default: the tag on the dashed rule is the handle and the milestone's own row is hidden, since the rule already spans the chart. Long titles wrap, and a tag that would still collide with its neighbour drops to a second row. Diamond style keeps the row.
Bar notes. Put a short label on the bar body, the way durations are annotated on a printed plan. Double-click a bar to type one, or use the note field in the editor.
Resizable name column. Drag the divider between the names and the timeline, or double-click it to fit the longest name. The width persists.
Room to scroll. You can scroll past the last row, so the bottom of the plan can sit centred in the pane instead of pinned to the bottom edge.
Clean group labels. A trailing date range in a group label is dropped at render, since the axis already shows the dates and the text goes stale as soon as the plan moves.
Sticky axis and section headers. The date axis stays pinned at the top while you scroll the plan, and the header of whichever section you are in pins just beneath it, handing off to the next section's header at the boundary. Horizontal scroll still slides the axis with the bars so dates stay over their columns. A pinned header is the real row: click it to rename the section, use its chevron to collapse, drag it to reorder.
Authored default view. project.view in the data file pins how the chart opens: lens (mode), grain, milestone style, today marker, theme and name-column width. The HTML export bakes it in and ignores the viewer's saved preferences, so a shared snapshot always matches the image that invited the click. In the live app your own choices still win.
Changelog. Every edit is appended to <datafile>-changelog.jsonl with the item, the before and after dates, the day shift, and which gesture made it. An AI picking the project up later reads it and builds on your changes instead of overwriting them. The rev counter in the bottom-left corner is the handle: an agent notes it, then asks for only what changed since.
In action
Click a bar and the inline editor opens over the chart: date pickers for start and end, plus the incoming ("needs") and outgoing ("blocks") dependencies, each removable, with a picker to add more.
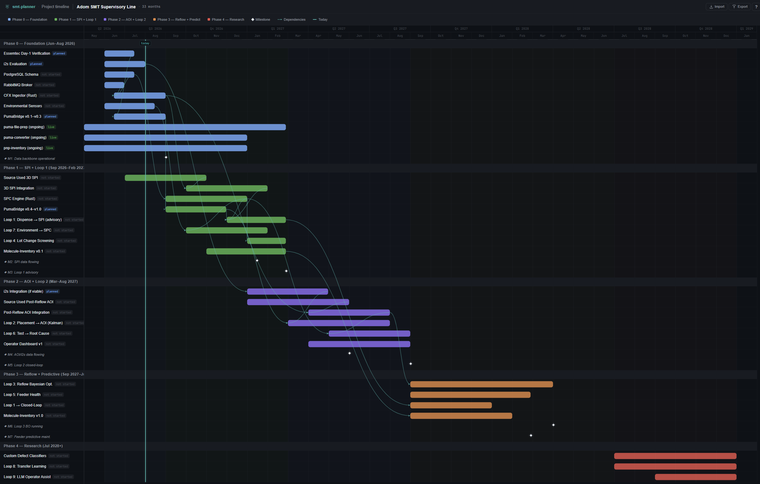
The layout scales to real plans. This is the bundled SMT production line example: 5 phases, 43 items, 8 milestones, striped bars for ongoing work:
Quick start
node server.js --data examples/sample-product-launch.json --port 8901
Open http://localhost:8901 in a browser, or point a Hydrogen webview tab at the proxy URL.
Data file format
Create a JSON file with three sections:
{
  "project": {
    "title": "My Project",
    "subtitle": "Short description"
  },
  "phases": [
    { "name": "Phase 1 — Build", "lead": "the long pole (Adonis)", "start": "2026-01", "end": "2026-06" }
  ],
  "items": [
    { "type": "task", "id": "t1", "name": "Task name", "start": "2026-01-15", "end": "2026-03-01", "phase": 0, "owner": "Adonis", "status": "planned", "description": "Details.", "deps": ["other-id"] },
    { "type": "milestone", "name": "M1: Goal reached", "date": "2026-06-01", "phase": 0, "description": "What this means." }
  ]
}
Tags are optional on a phase and on a task or milestone: "tags": ["Tech"], a
short list of short strings. The server trims them, drops duplicates that differ only
in case (the first spelling wins), caps each at 32 characters and the list at 12, and
writes no tags key at all when there are none, so a plan without tags round-trips
unchanged. A tag change is saved in the sidecar and logged as tags (a row) or
phase.tags (a section). Section tags travel in the JSON export and the HTML snapshot;
a CSV is rows, so its tags column carries row tags only.
Since 0.59.0 section tags are edited on the Setup tab: a tags line under each section (type a tag, Enter or a comma to add it, the x on a chip to remove it, suggestions from the tags already in the plan) and a Tags card that lists every tag with how many sections carry it and renames or removes one everywhere. If sections are named with a prefix, like "Tech · Fab", one button tags each with its prefix; it adds tags and never renames. In the legend, a chip per tag leads the line and the section chips fold behind it: choose one or more tags to see only the sections carrying any of them, in the chart and the table. Every tag edit is one Ctrl+Z; the filter is your view only and survives a refresh.
Omit color on a phase and it follows the Adom brand ramp, which adapts between dark and print. See SKILL.md for the full field reference and the ramp values.
Sections are phases
phases[] is the whole truth about the sections a plan has. Each one renders its
own header row, in phases order, with its item count, including a section with
nothing in it yet. There is no "group" item type any more: headers are derived,
so renaming a header renames the phase and the change shows up in the legend, the
table's phase column and every phase dropdown at once. Dragging a lane reorders
phases[] itself, which is why the legend and the chart can no longer disagree.
The Setup tab is the editor (since 0.58.0; until then it was a modal behind a
Sections button in the top bar): add a section, rename it, give it an aside,
recolour it from a brand-safe palette (or a #rrggbb of your own), reorder it, or
remove it. Each section's row shows how many rows it holds and the first and last
dates among them. An empty section goes on its own; one with rows in
it makes you say where they land, so nothing is ever orphaned. Every change is one
Ctrl+Z and one changelog line.
A lead is the short aside beside a section name ("the long pole (Adonis)"), shown
as secondary text. Older data files that still carry type: "group" rows load
normally: each is absorbed into its phase, contributing its aside as the lead.
Item ids that do not move
Every row carries a uid: a zero-padded number, assigned once, that nothing can
change. It is written into the file for you, so you never type one.
{ "type": "task", "uid": "00042", "id": "t1", "name": "Task name", "...": "..." }
It exists because every other name a row has is conditional. A task id is a slug
of the name the row had when it was made, so it reads as a lie after a rename. A
group or a milestone has no id at all and is tracked by its position in the file,
which renumbers whenever the file is restructured. A uid is a number, it means
nothing, and it survives a rename, a reorder, a move between lanes, a compact and
a round trip through CSV.
- Assigned once, in the order the plan reads, the first time a server on this
version starts on your data file. It backs the file up first (
.pre-uid.bak). - Handed out by the server, from
project.nextUid, one at a time. A browser never invents one, so two people adding a row in the same second cannot collide. - Retired on delete. The number goes with the row and is never issued again, so a stale reference resolves to nothing rather than to somebody else's row.
- Carried by every export, and read back by every import.
Select rows and press the Copy IDs button (or Ctrl+C) to get uid, a tab, and the
name, one row per line: paste that into an AI chat, ask for a batch of edits, and
every edit lands on the row you meant. Tasks and milestones can both be selected;
lane headers cannot.
Row order, deletions and every saved edit are keyed by uid too, in both the data file and the sidecar. That is what makes it safe to insert a row into the middle of a plan: nothing below it is identified by its position any more. Sidecars written by older versions are translated on the way in and keep working.
Sharing a plan with your team
Every page load and every change requires a signed-in Adom account. An unauthenticated visitor gets a sign-in page and nothing else: no plan data is sent before the session exists. Sign-in uses Authentication Intents ("Sign in with Adom"), the session lives in an HttpOnly cookie for 30 days, and it survives a server restart.
Your identity does three things once you are signed in. The header shows who you are signed in as, and clicking it gives you your details and a way to sign out. A new task defaults its provenance to "Added by ", still editable. And the changelog records what you did under your real name, so a shared plan's history reads "Drew Owens moved X" rather than "user moved X". The actor is taken from the session and never from the request body, so it cannot be spoofed.
Reading the plan from inside the container is still open. A GET of /data,
/state, /changelog or /export/* over direct loopback (127.0.0.1, no proxy
headers) needs no session, which is what keeps an AI agent's read-and-hand-off loop
working. Anything that CHANGES the plan needs a signed-in person no matter where it
came from. This is not a security boundary and does not pretend to be one: anything
already running on loopback in the container can read the data file directly.
Run with --no-auth to turn all of this off for a single-user local session.
Letting an AI agent write, without breaking the history
Reading is open over loopback, but writing needs a signed-in person, and an agent has no
browser to sign in with. That left an agent asked to change a plan with one option:
writing the data file and the changelog directly. The changelog's hash chain catches
exactly that and reports it on /health as integrity.ok:false, so an agent edit was
either indistinguishable from tampering or it never happened.
The agent token is the door for it instead. At startup the server writes 32 random
bytes, hex, to a 0600 file beside the plan, and reuses that file forever after:
dc-demo.json                 the plan
dc-demo-state.json           the sidecar
dc-demo-changelog.jsonl      the history
dc-demo-agent-token          the agent's key       <- 0600
The startup log prints the path, never the token. Send it as a bearer token and the request is allowed the same mutations a signed-in person gets:
TOK=$(cat /path/to/dc-demo-agent-token)
curl -s -X POST http://127.0.0.1:8901/log \
  -H "Authorization: Bearer $TOK" -H 'Content-Type: application/json' \
  -d '{"events":[{"action":"note","id":"log-ship","to":{"note":"venue confirmed"}}]}'
What that buys you is an audit trail instead of a mystery. The write goes through the
same handler, the same append path and the same hash chain as everybody else's, so
integrity stays ok:true, and every event it produces is recorded under the actor
adom-gantt agent. The changelog then reads:
adom-gantt agent labelled "Ship the workcells to DC" "venue confirmed"
The name is forced. An actor in the request body is ignored the same way a person's
would be, so an agent edit can never be read back as somebody's own.
The token does not hand out a session or a cookie, and it does not open the app
page: GET / with a token returns the sign-in page exactly as it does with nothing,
because the token is an API credential and not a seat in the app. A missing or wrong
token is a 401 with the same body a request with no session gets.
This is not a secret from anything already running in the container, and does not pretend to be: a local process can read the plan and the token alike. Its job is to make agent edits auditable rather than invisible.
Known limitation: two people editing at once
The save model is whole-state, and it is last-write-wins. If two teammates have the plan open and both edit, the second save overwrites the first, and the only record of what was lost is the changelog. There is no merge and no operational transform.
What the app does do is refuse to be the one that erases you silently. Every save carries the revision it was based on; if the plan moved since you loaded it, the save is refused with a 409, and you are told, loudly, and you keep being told.
A red banner comes up at the bottom of the window on the FIRST refused save, autosave included, and it stays up until the situation is resolved. It reads "Your changes are not saving. This plan changed somewhere else." and it counts how many of your changes have not been saved. The save indicator in the corner goes into an error state and stays there, so the tab never looks idle or saved while it is not saving. Nothing you do in the app takes either of them down: an undo, a delete, a dependency change, an auto-schedule, even pointing at the banner and looking away, all leave it exactly where it is.
Your own edits stay on screen until you decide, and the banner gives you three ways out:
- Export my version writes your in-memory plan to a JSON file, so nothing is ever trapped behind the banner.
- Save mine anyway force-overwrites the other change, behind a confirm click.
- Reload latest takes the server's version. If you have unsaved changes it warns you first, names how many are about to go, and offers the export in the same row.
There is a fourth way out that costs you nothing: if a save starts working again, the banner clears itself.
The changelog cannot run ahead of the plan. Changelog lines are chained to the save that carries them: while your saves are being refused, your lines queue in the tab rather than posting, and they go out in order behind the first save that lands, or are dropped along with the edits if you choose to discard them. A tab that is not saving is not writing anything anywhere, which is the whole point. Before 0.54.0 the two were independent and a blocked tab kept filling the changelog with edits the plan never got.
The practical advice is unchanged: for now, edit one at a time, or reload before a long editing run.
Keyboard shortcuts
| Key | Action |
|---|---|
| Ctrl+Z | Undo |
| Ctrl+Shift+Z | Redo, also Ctrl+Y. Replays only what undo took back, so any new edit clears it |
| Up / Down | Move the selected row in the table, following the visible order under sorts and filters. They never scroll the pane by themselves; it moves only enough to keep the selected row in view |
| Enter | Edit the selected row's name. Inside a cell, commit and step down one row |
| Delete | Delete the selected row, undoable. Only when a row is selected and no field is open, so Delete inside an editor just edits text. Backspace is deliberately not bound |
| Shift+D | Dependency mode: click the task that comes first, then the one that waits on it. The Deps button glows in the accent for as long as the mode is on, and its tooltip is the instruction. The row under the pointer lights up across both panes, tinted in its own phase colour, so you can see which task you are about to click. The armed first task wears the normal selection outline. Clicking a pair that already has a dependency removes it. Click an arrow to pick it, then Delete twice to remove that one. Stays on so you can chain them. Esc lets go of a picked arrow, then the pick, then leaves |
| Shift+N | Open the New panel. Fires only when nothing else is going on, so a capital N typed into a field stays a capital N |
| Ctrl+C | Copy the selected rows, tasks and milestones alike, to the app's own clipboard, ready for Ctrl+V. It ALSO puts their permanent IDs and names on the system clipboard, one per line, which is what it has always done and what an AI batch edit reads. Answers only when the app is idle and there is no live text selection on the page, so a Ctrl+C aimed at text you have highlighted, or typed into any field, is the browser's copy and never this |
| Ctrl+V | Paste the copied rows as new rows. With a row selected they go DIRECTLY BELOW it (below the last of a set, in plan order) and into its lane; with nothing selected they go to the end of the lane you are looking at. Dependencies among the copied rows are remapped onto the copies, so a copied chain is a chain; dependencies pointing outside the set still name the originals, and nothing downstream of an original is changed. The whole paste is one Ctrl+Z |
| Alt+Up / Alt+Down | Move a row one slot: the focused row in the table, the selected task in the chart. Crossing a lane boundary moves the row into that lane, and a lane that is collapsed OPENS the moment the moving row lands in it, so you can see what you are moving among. Under a column sort the row stays inside the run of rows the sort considers tied with it. The pane follows the row it is moving, keeping five rows visible ahead of it in the direction of travel, and both columns stay locked. With several rows selected the whole set moves as a group; if the selection has gaps in it, the FIRST press closes it up into one block at the topmost selected row and every press after that moves the block |
| Tab / Shift+Tab | In the table, walk the selected row's fields. With no editor open it opens the first editable cell (Shift+Tab the last); with one open it commits and moves to the next. Wraps across rows and around the ends, and follows the visible order under a sort. With no row selected, Tab walks the page's own controls as usual. In the edit panels it is one keypress per field the same way, including the date fields, which Tab leaves whole instead of walking their day, month and year segments |
| Esc | Leave the field first: pressed with the caret in any text box it takes the focus back out of it, so the keyboard shortcuts work again on the very next keypress. It does not clear the box, and it does not do anything else in the same press. Fields that already have an Esc of their own keep it (a name editor cancels, a dropdown's type-in closes the list, a panel field closes the panel). With nothing focused it goes on as before: cancel the open field, then clear the row focus, then clear the selection |
| Ctrl+click | Toggle item in selection |
| Shift+click | Range select |
The focused row is the row whose cell editor you touched last, marked with an accent bar down its left edge. It is not a separate thing to click: the edit you were already making is what tells Alt+Up and Alt+Down which row you mean.
Interactions
Dragging a bar snaps it to the visible time grid: day boundaries at the day cell size, week starts at weeks, month, quarter and year firsts at the coarser ones. The preview jumps line to line as you cross each midpoint, and what you see is what is committed. Resizing an edge moves that edge only; dragging the body moves the start and keeps the duration. Milestones snap the same way. Dates typed into the table, the item editor or the batch editor are taken exactly as typed.
| Gesture | Action |
|---|---|
| Gantt / Table / Analytics / Setup | Switch lens. Pinned to the left of the header so it never moves. Setup is where sections are added, renamed, recoloured, reordered and removed |
| Fit | Fit the whole plan into the pane, no horizontal scrolling |
| Auto-schedule | Push every task out to its dependencies, finish to start, skipping weekends and US federal holidays. Never pulls work earlier, so intentional gaps survive. One undo. Disabled when the plan has no dependencies |
| Critical | Light up the longest run of work inside every section, cancelled work left out. On/off, and it recomputes as the plan changes |
| A- / A+ | Step the text size for both views. Click the percentage to reset |
| Collapse all / Expand all | Fold every section to its header, or open them all. Start of the legend |
| Click a # tag chip in the legend | Show only the sections carrying that tag (or any of the chosen tags), chart and table. Clear tags undoes it. Your view only |
| Hover "today" | The current date |
| Click a table cell | Edit owner, start, deadline, status or notes in place |
| Click a table header | Sort by that column (deadline ascending by default) |
| Click bar or label | Select + open editor |
| Drag bar edge | Resize start or end date |
| Drag bar body | Move bar (preserves duration) |
| Drag vertically | Reorder rows |
Server endpoints
Everything below the door needs a signed-in session, or an Authorization: Bearer <agent-token> header. GETs of /data, /state, /changelog and /export/* over direct
loopback are open. /health is public and leaks nothing but counts.
| Endpoint | Method | Description |
|---|---|---|
/health |
GET | Public. Rev, event count, and the changelog's integrity object |
/data |
GET | Current project data |
/state |
GET | Saved edits (sidecar) |
/save |
POST | Persist edits |
/uid |
POST | Allocate the next permanent item id. {"count":n} for a batch, up to 500 |
/uid/backfill |
POST | Give a uid to any row that has none. Runs at startup too, so this is only for a data file edited under a running server |
/changelog |
GET | Edit history. ?since=<rev> for the tail, ?format=md for the readable version |
/log |
POST | Append events to the changelog (used by the app, and by an AI recording its own edits) |
/changelog/reset |
POST | Delete the changelog |
/import/json |
POST | Import native JSON |
/import/csv |
POST | Import CSV |
/import/msproject-xml |
POST | Import MS Project XML |
/import/jira-csv |
POST | Import Jira CSV |
/compact |
POST | Bake saved edits into the data file and empty the sidecar |
/export/json |
GET or POST | Export merged JSON. GET renders the plan on disk (the AI/loopback loop); POST renders the client model in the body, which is how the Export button reflects unsaved edits |
/export/csv |
GET or POST | Export CSV, same GET/POST split |
/export/svg |
GET or POST | Export SVG, same GET/POST split |
/export/html |
GET or POST | Export self-contained HTML, same GET/POST split |
Examples
Two example datasets are included:
examples/sample-product-launch.json: 4-phase hardware product launch (26 items, 4 milestones, dependency graph)examples/smt-line.json: 5-phase SMT production line build (43 items, 8 milestones)
Tests
A browser suite drives the real app in headless Chrome against a seeded 20-section plan on a scratch port: every behaviour above that 0.57.0 touched, a control-coverage gate that fails on any control nobody declared, a phone and two desktop widths, and a page-error gate on every page.
cd test && npm install        # puppeteer-core, once; Chrome from ~/.cache/puppeteer
node test/ui_test.mjs         # exits non-zero on any failure
node test/ui_test.mjs --keep --plan path/to/plan.json   # also a real plan (copied first); keep screenshots in test/out/
node test/ui_test.mjs --only "editor: item,text size"   # a subset of flows, for a fast inner loop
A full run takes about 12 minutes (14 with --plan). Since 0.57.1 the suite also opens every editor and menu, sweeps the header at 54 widths in every lens (four since 0.58.0), fails on any failed request to the app's own server, and fails when a control marked safe was never clicked. Controls with no test are marked untested with a reason and counted in the summary, so the gap is stated and not hidden.
Collaboration
Each team member runs their own server instance with the same data file. Use Export (JSON) to share the current state and Import (JSON) to load a colleague's version. The data file and sidecar state file can also be committed to a shared git repo for async collaboration.
License
Internal tool. Adom Inc.