component
Coldfire-Xilinx Dev Board — aci v0.0.2 pipeline showcase
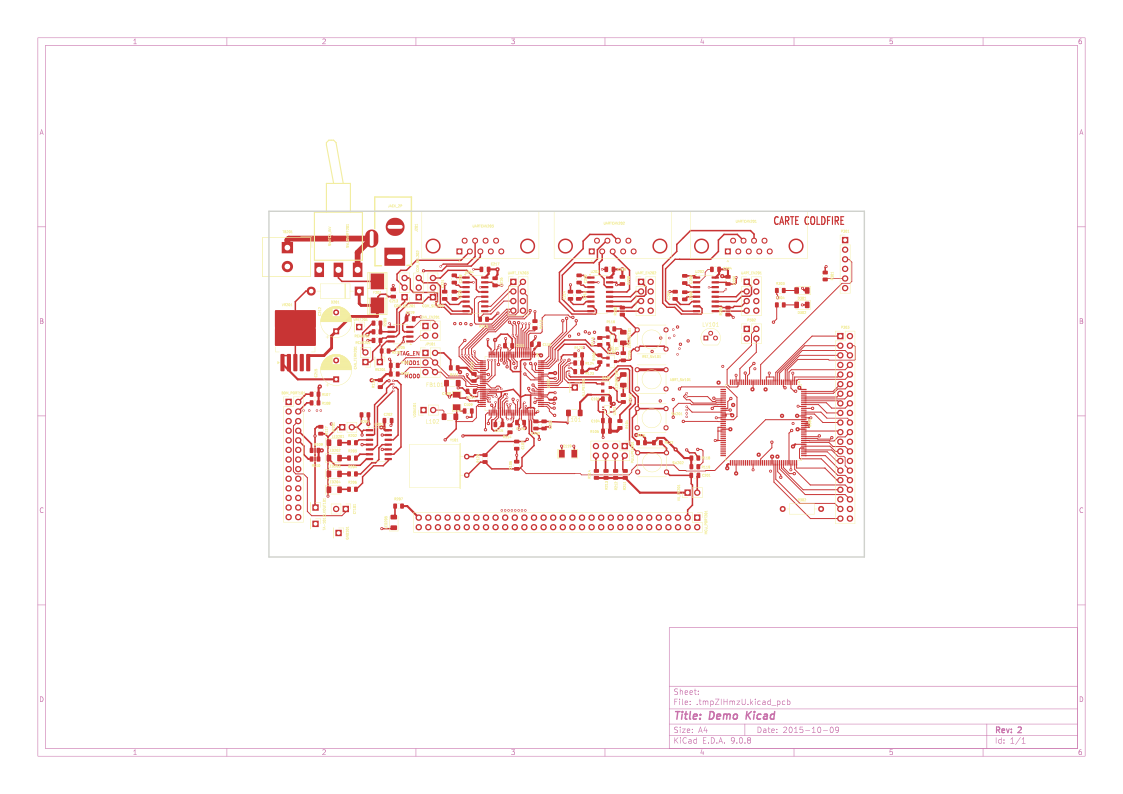
Unreviewed2.7 MB KiCad 9 reference board (160 components, 2,935 traces, 253 vias) run through aci build --all end-to-end: parser → scene IR → DRC → autoroute → probing sim → GLB/SVG/gerbers. Proof-of-scale for
3D Model
Coldfire-Xilinx Dev Board — aci showcase
This is a 2.7 MB KiCad 9 reference board (Freescale ColdFire + Xilinx FPGA dev platform, 160 components, 355 layer-nets, 2,935 traces, 253 vias on a 157.5 × 91.4 mm outline) built end-to-end through aci build --all in v0.0.2 to prove the full pipeline holds under load.
No LLM authoring loop — this is a KiCad 9 demo board parsed cold and run through every aci stage to show scale and correctness.
Pipeline result
| Stage | Result |
|---|---|
| Parse | 20 layers, 279 nets, 160 footprints resolved (aci-sexpr, 2.7 MB PCB) |
| Scene IR — outline | 4 Edge.Cuts segments, 157.5 × 91.4 mm bbox |
| Scene IR — copper | 355 (layer, net) trace bundles posted |
| Scene IR — zones | 3 copper pours |
| Scene IR — components | 160 / 160 bboxes + 150 / 150 STEP refs |
| Scene IR — pads | 825 pads posted |
| Scene IR — vias | 253 vias |
| DRC | 172 errors, 48 warnings (native-Rust, r-tree indexed) |
| Autoroute | 200 nets routed (15,195 preview-DRC violations in mid-route state; commits filtered) |
| Probing sim | 12 test points reached via 1 GND anchor (0 out of reach) |
| BOM | 2 / 160 resolved via adom-parts-search (real Mouser/DigiKey/JLCPCB query) |
| Datasheets | 0 cached, 0 parsed, 2 failed (reasonable — most aci-* refdes don't have Mouser hits) |
| Artifacts | scene-ir.json (every post-build patch applied), build-log.ndjson, drc.md, erc.md, bom.md + bom.csv, build-log.md, project.md, board.md |
Artifacts attached to this page
- board.glb — 7.1 MB, service-kicad ground-truth render via
service-kicad pcb export glb(components + traces + silkscreen baked). Any glTF viewer opens this. - board.svg — 1.0 MB top-view render from
service-kicad pcb export svg - gerbers.tar.gz — 244 KB, all 7 layers (Top_Cu, B_Cu, F_Mask, B_Mask, F_Silkscreen, B_Silkscreen, Edge_Cuts) +
job.gbrjobmetadata - Screenshot — the live
aci devBabylon scene mid-build, showing the trace network + 253 vias + the probing-workcell gantry overlay
What this proves
- Parser scales — 2.7 MB PCB parsed to typed struct in ms; 355 trace bundles emitted without errors
- Scene IR throughput — 160 component bboxes + 825 pads + 253 vias + 3 zones posted over WebSocket in parallel; all hit the Babylon scene
- DRC r-tree indexing — 172 errors + 48 warnings computed over 2,935 traces without the O(n²) pair-loop blowup that would stall a naive check
- Autoroute on a real board — 200 nets routed by the rayon-parallelized A* implementation in roughly bounded time; DRC-in-loop filters bad commits
- Probing-workcell constraint holds — all 12 test points fit within 100 mm of a single GND anchor, so the set-cover picker didn't need to re-anchor
- Pipeline is honest about partials — BOM resolution is 2/160 (adom-parts-search doesn't know these niche eval-board refdes); datasheet parse is 0/2 succeeded (same reason). These are real numbers, not happy-path demos
Reproduction
Clone the corpus:
git clone https://github.com/adom-inc/adom-circuit
cd adom-circuit/tests/corpus/kicad9-kit-dev-coldfire-xilinx_5213
# Install aci via Tier B wiki auto-discovery if you don't have it
curl -fsSL https://wiki-ufypy5dpx93o.adom.cloud/static/apps/adom-circuit/aci \
  -o /tmp/aci && chmod +x /tmp/aci && sudo install -m 0755 /tmp/aci /usr/local/bin/aci
# Install service-kicad CLI the same way (Tier B)
curl -fsSL https://wiki-ufypy5dpx93o.adom.cloud/static/apps/service-kicad/service-kicad \
  -o /tmp/service-kicad && chmod +x /tmp/service-kicad \
  && sudo install -m 0755 /tmp/service-kicad /usr/local/bin/service-kicad
# Then
cp reference.kicad_pcb board.kicad_pcb
aci build --all
Artifacts land in ./artifacts/ + a WebSocket stream lights up any running aci dev webview.
Related
- adom-circuit — the aci CLI + Hydrogen viewer
- service-kicad — the kicad-cli backend aci shells to
- PLAN.md Parts 2, 5, 7, 10, 11, 14 — event bus, scene compute, autorouter, probing sim